We are a curious being. Every answer to a question leads to another question.
The same stands true when we design a report for decision-making. It is nearly impractical to create a report which answers all the questions. And not all have the required skill set or time to build a report on their own.
It would be an excellent feature in our reports, which can answer to our questions. Questions that we can write as if we are talking to a person. Not in codes or keywords, but plain and simple English.
The good news is that Power BI Q&A offers a solution in this context. Using common phrases and natural language, we can ask questions in a report and get an output in the form of a visual using Power Q&A.
For instance, consider the following data model:

dtReturns table contains a list of all the returned orders, and the ftUsers contains the Manager's name by region.
Download Sample File
To identify the top 3 managers with the highest refund amount, we can ask Power BI using the same words:


And this is possible because:
Our data tables are well defined and related
We have added measures to calculate the sales amount & refund sales amount:
 Sales Amount =
  SUMX(
   dtOrders,
         dtOrders[Order Quantity] * dtOrders[Unit Price]
  )


 Returned Sales Amount =
 CALCULATE(
  [Sales Amount],
    FILTER(
      dtOrders,
        RELATED(dtReturns[Status]) = "Returned"
   )
 )
Refer to the following articles for more details on DAX measures:
How to access Q&A in Power BI?
There are multiple ways we can add Q&A visual to a Power BI report.
Setting up as a visual
Visualization Pane > Q&A

Or
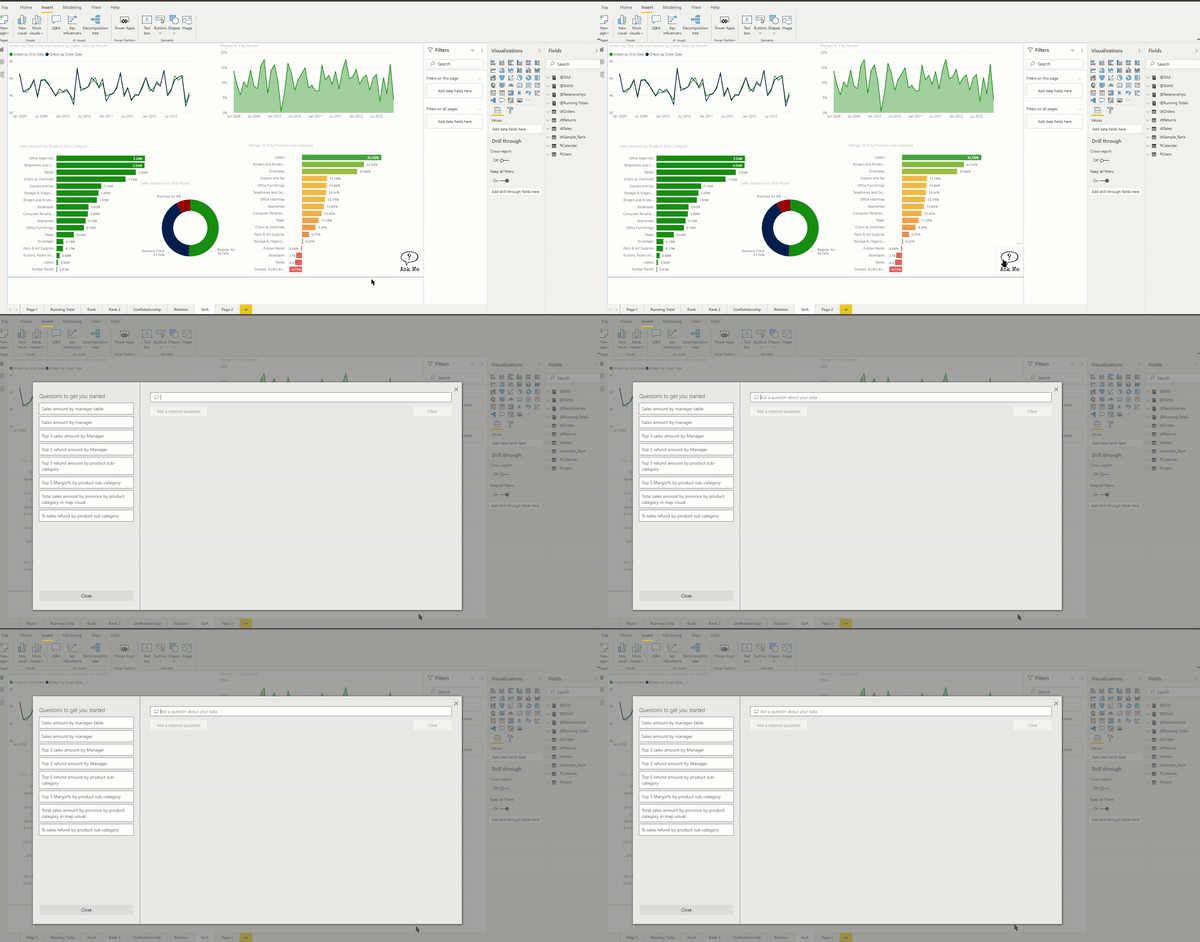
Insert Ribbon > Q&A

Or, double-click on a vacant space in the report canvas.
It adds Q&A as a visual in the Report pane

Setting up as a button or image
Add a button/image > Format > Action > Type > Q&A

Q&A window will pop-up when we click (ctrl-click in case of PBI desktop) the image/button

Power BI Service: Dashboard
On the top of every dashboard in the Power BI Service, we get the Q&A:

Configuring Q&A
Q&A considers the existing structure of the data model for the answers; hence it is crucial that:
We create robust relational data models. Get rid of unwanted tables from the data model.
Every column and measures have reasonable names. Avoid common column names in the data model.
Assign right formatting to date & number fields. If the data model has location fields, assign proper category:

Everyone has their way of referring to a column or calculation. For example, one may refer to Total Sales as Total Revenue. In such cases, we can train the existing data model by adding Synonyms in the Model View:

A word of caution while defining synonyms: Do not assign the same synonym to different columns or tables.
Q&A tries to find the best match related to the question's full context, taking relationships between different objects into account. However, it may return a different answer than expected when multiple items have the same synonyms.
Besides adding synonyms, we can also add phrasing (our own set of suggested questions):

The next section talks about how to train the Q&A for adding suggested questions.
How to add suggested questions in Q&A?
Go to Modelling > Q&A setup

Getting Started screen > Suggest questions

Suggest questions screen:

Autocomplete
When we start typing our question, it shows relevant and contextual suggestions. It helps in framing our questions effectively. It is like typing in a search engine like google.

Blue vs. Red underlines
It is a clear differentiator between which keyword Q&A understands, which it does not. A solid blue underline shows that the Q&A successfully matched the word to a column or a value in the data model.

A red underline can show one of two potential issues.
The first type of issue is when it could not find anything matching. If you type a vague or ambiguous word, Q&A underlines the word in red. For example, the term 'Sales'. Multiple fields could have 'Sales' as name, so the system uses a red underline to prompt you to choose the field you meant.
Another example of low confidence could be if you type the word 'area', but the column it matches is 'region'. Power BI Q&A recognizes words that mean the same thing, thanks to integrating with Bing and Office. Q&A underlines the word in red, so you know it is not a direct match.

In such cases, we teach the Q&A to make it robust.
Teach Q&A
We need to add such keywords using Teach Q&A

All such definitions stored under Manage Items:

Now, when we add that as a question, blue underline replaces the red underline

Click Add to add the question in the list:

We can rearrange the series of the question by dragging and then click Save to update the order of the list of questions.
We can get a similar list under Review Questions. It is the list of all the questions asked by other report users:

Adding Q&A as a visual
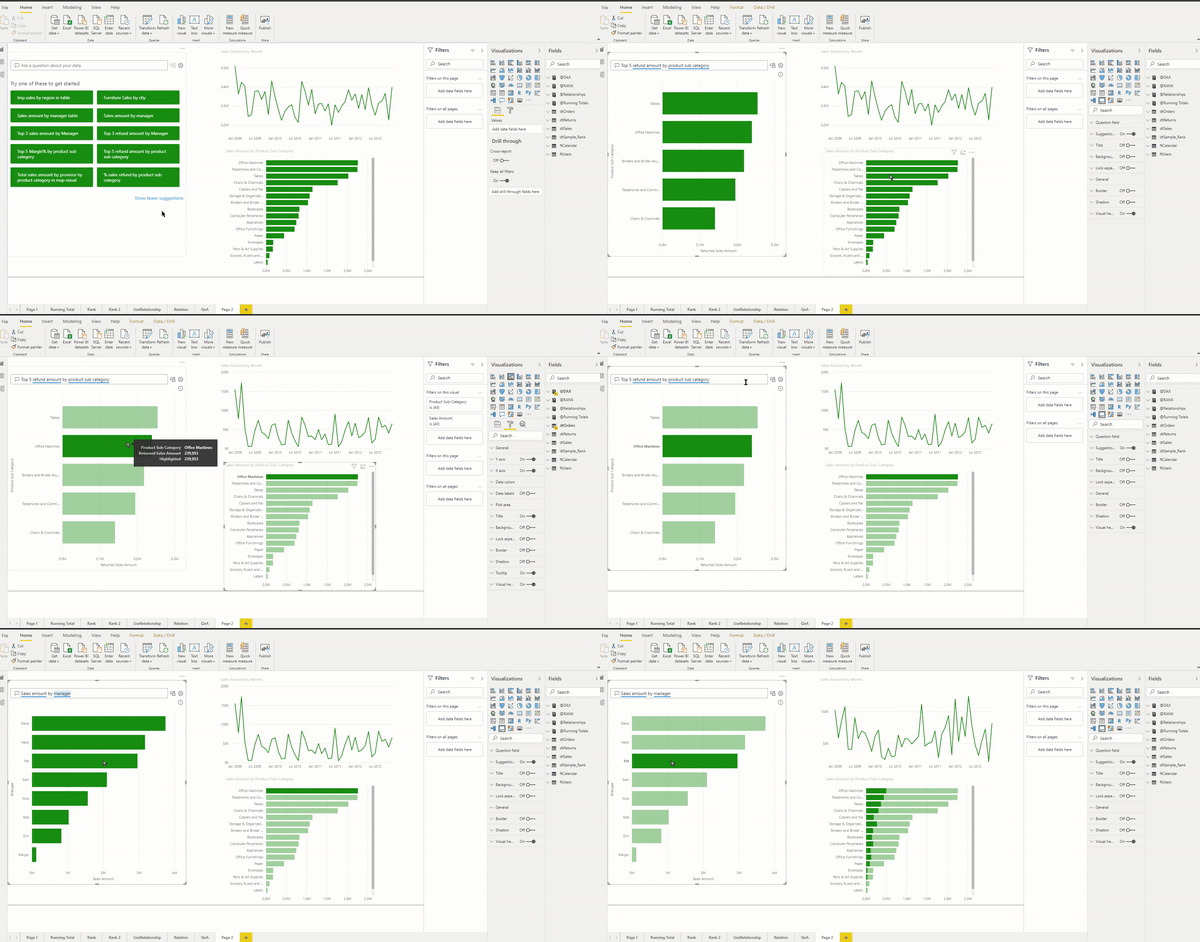
When we add Q&A as a visual, the interactivity works like regular visuals in Power BI:

And we can define the visual type as part of the question:

Q&A is a handy feature in Power BI Desktop, and we can use it to provide more flexibility to the user. The next article will cover the limitations of the Q&A visual.
Till then, keep asking questions.
In the below article, I have used Q&A visual to tell a story on a single page:
Also see: Q&A July 2020 update
