
One of my favorite aspects about Power BI Desktop is the regular updates it gets almost every month. And sometimes, it becomes a challenge to keep up with the changes. So, I decided to write about it. I can foresee two benefits: It affirms my knowledge about the product, and I get to share it with a broader audience.
This article outlines the features offered by the Model View.
As we know are aware, there are three views available in Power BI: Report, Data, and Model view
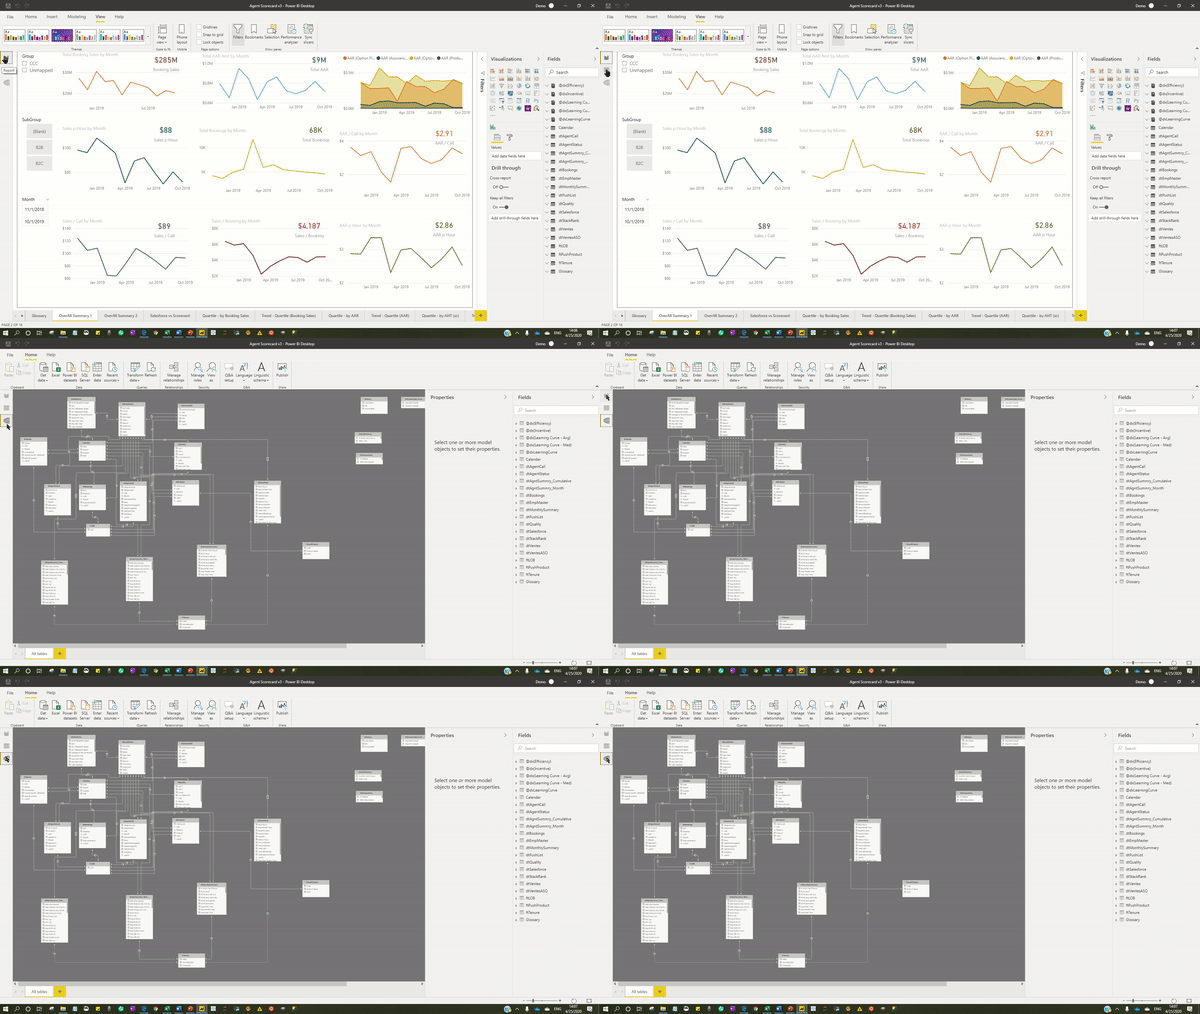
The primary objective of the Model View is to provide the visual representation of the relationships (type & direction) among the tables.

The above visual represents how the three filter tables related to the GL Data table.
But when the complexity of the model increases, then it becomes difficult to figure out which is what?


Adding Layouts
Layouts offer a streamlined and focused view of related tables. In this example, I would like to see the related tables for table dtMonthlySummary. I can create a dedicated view for this:
Add Layout > Add the table (dtMonthlySummary) in the view > Right Click > Add Related Tables
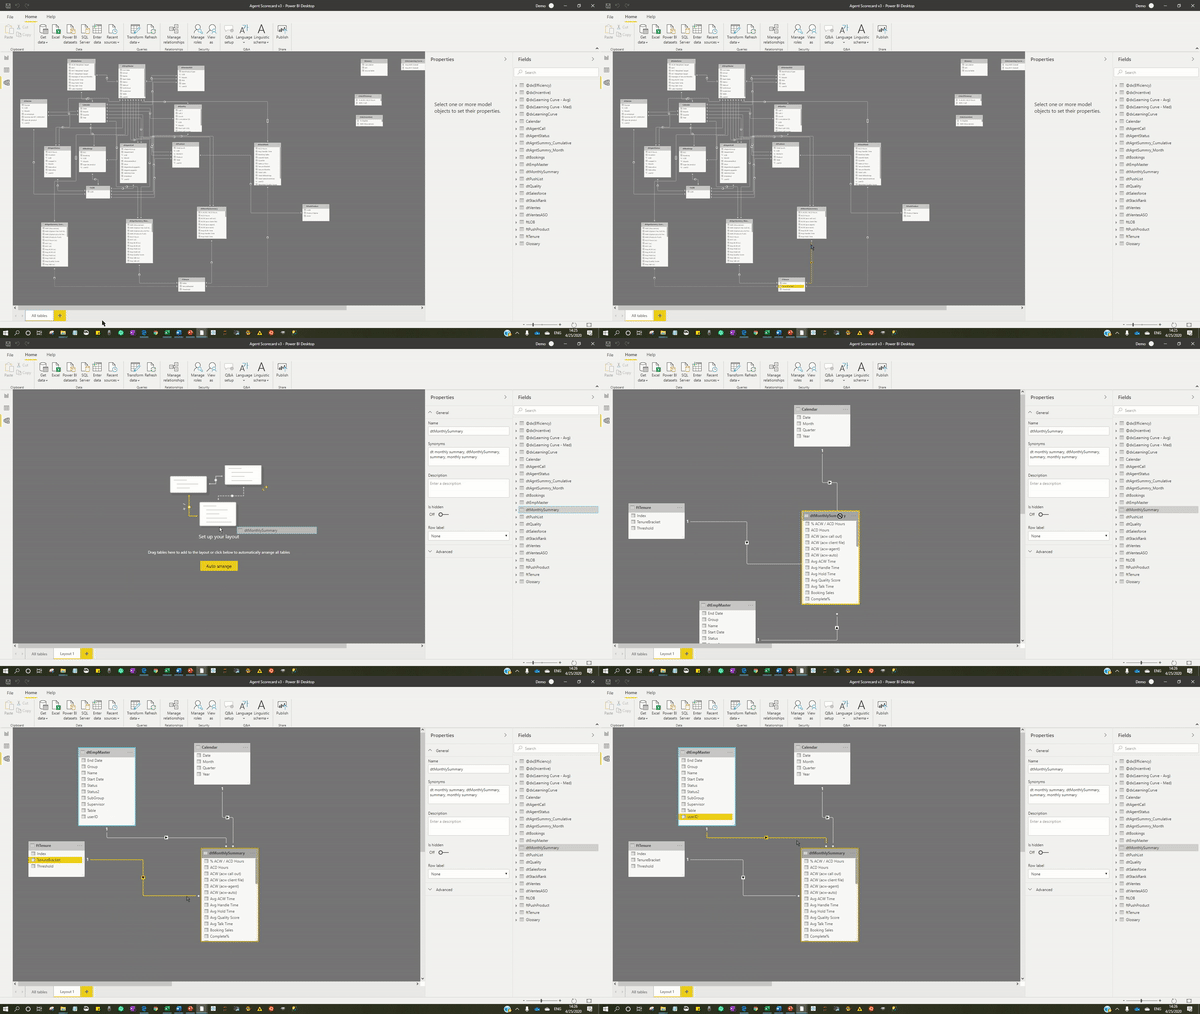
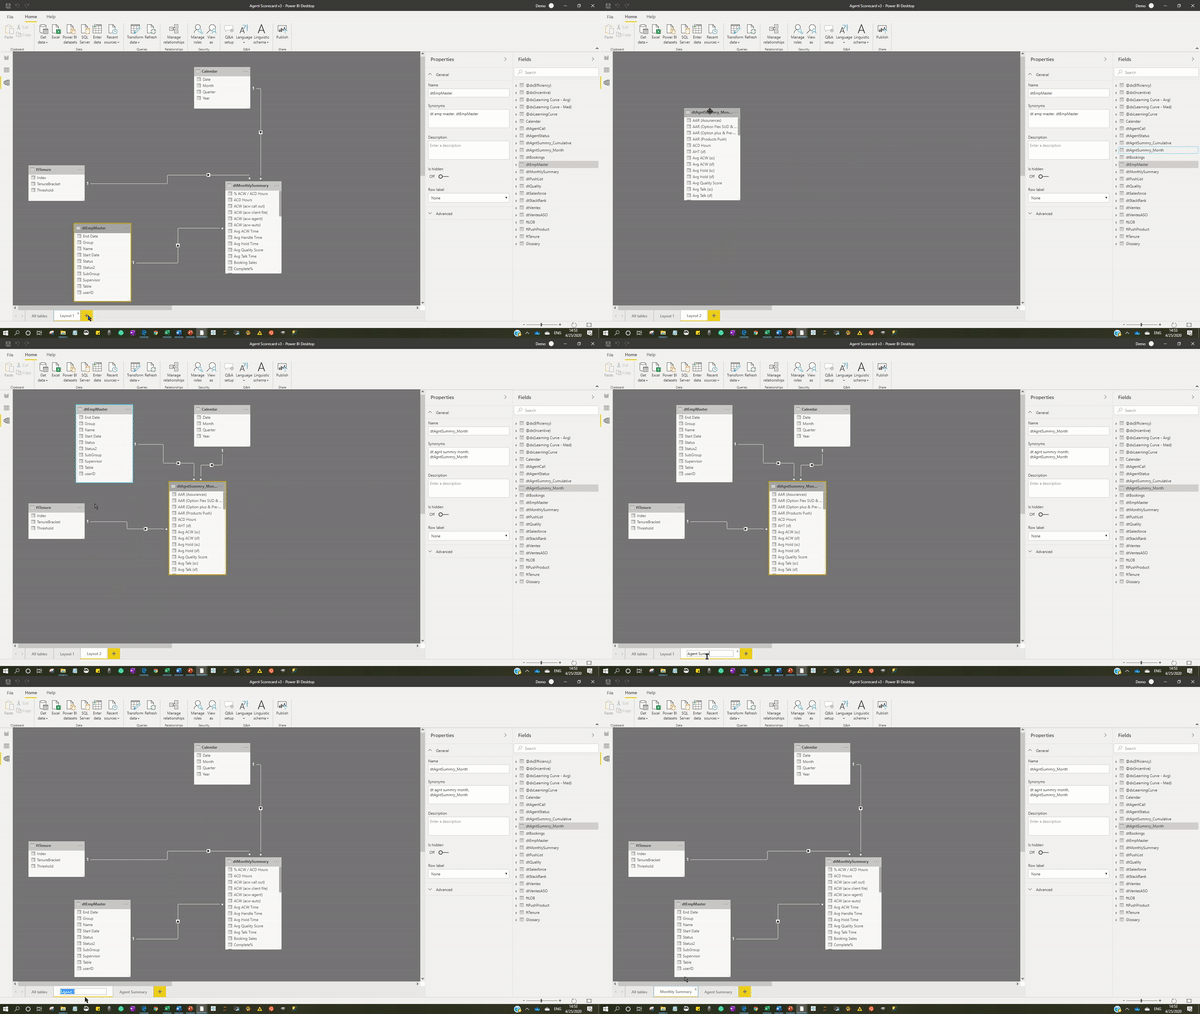
We can create multiple layouts, which helps us in understanding the data model effectively:
Multi-select columns or measures (& format at one go!)
The model view is the only view where I can multi-select columns or measures at one go.
What can we do with this?
We can format multiple columns or measures at one go from Model View.
Using CTRL or SHIFT keys, we can multi-select measures and columns and use the formatting option available in the view
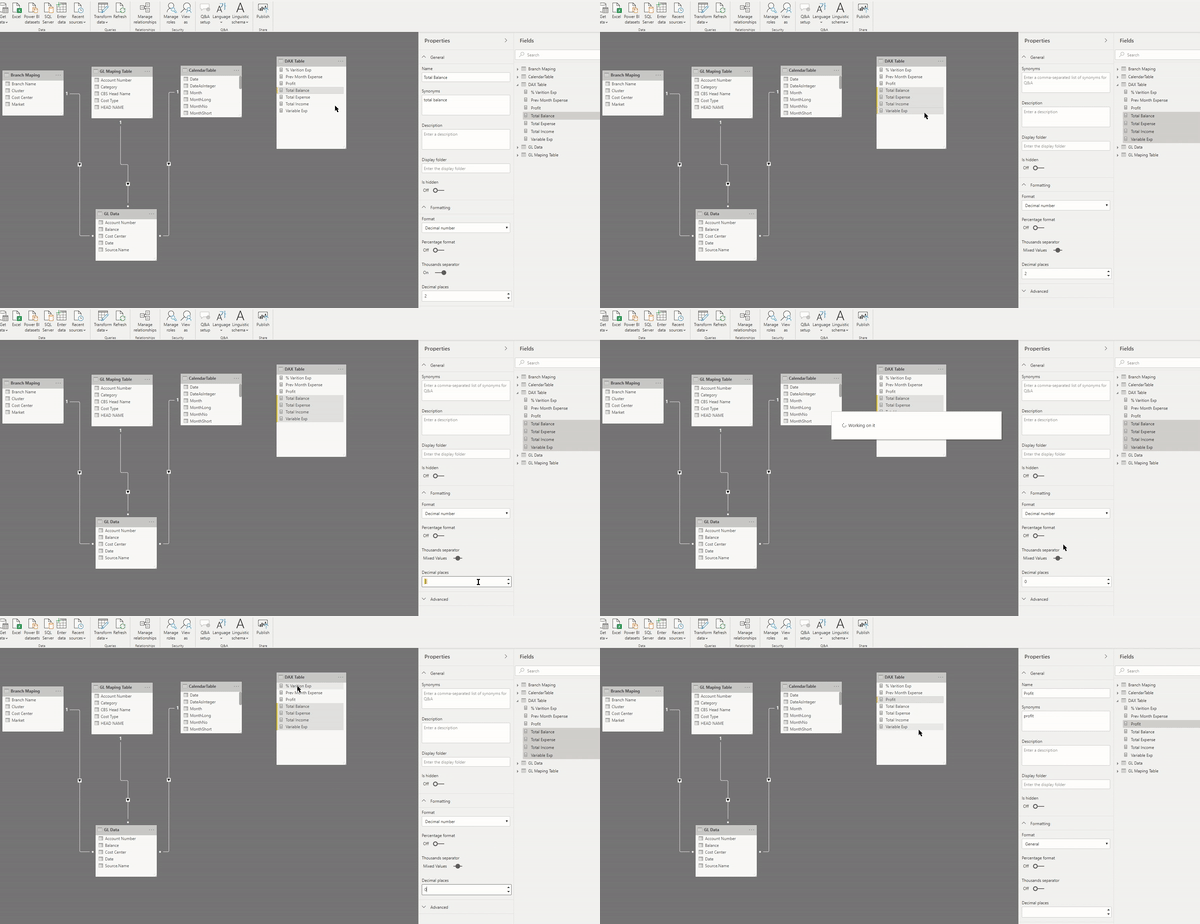
In Report & Data view, we do not get the option to do multi-select.
Hiding tables and columns from Report view
Selection fields for a visual could be a challenge when we have too many tables and fields.
Experts hence recommend:
· Hide all the unwanted tables and fields
· When we have a dimension-table connected with the fact-table, then hide all the common columns from the fact table. For example, if we have connected the calendar table with the fact table on Date, then hide the Date column from the fact table.
How to hide?
Right-click on the table or column > Hide in Report View

This way, we can limit the list of fields appearing in the Report view and enhance the user experience.
We can use the multi-select feature to hide multiple columns in one go.
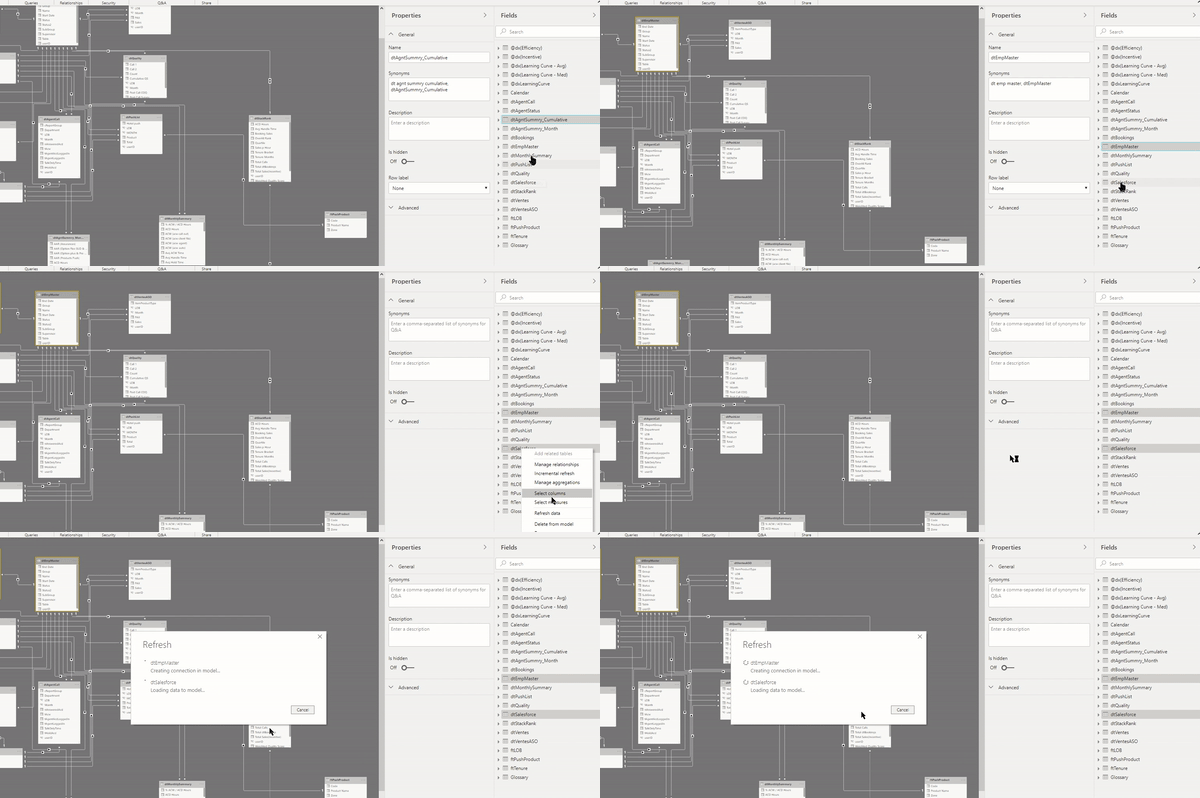
Refresh Selected Tables
The Refresh option available in the Home ribbon refreshes all the tables in the data model (which could be a time taking process, especially when you want only a few tables to refresh).
The Model view allows the users to refresh only selected tables present in a data model.
Create Folders
Folders help in organizing a set of information. In the case of Power BI, we can create multiple folders within a table to categorize similar fields.
Select the columns or measures > General > Display Folder > Enter the name for the folder

We can also drag and drop columns in the already created folder:

Folders make our Report View organized:
Before:

After:

Looking much better! Isn't it?
We can use the Model view to give a structured look to our Power BI data model.
So, which one are you going to use?
