Statistics Simplified is the series to express statistics in layman terms.

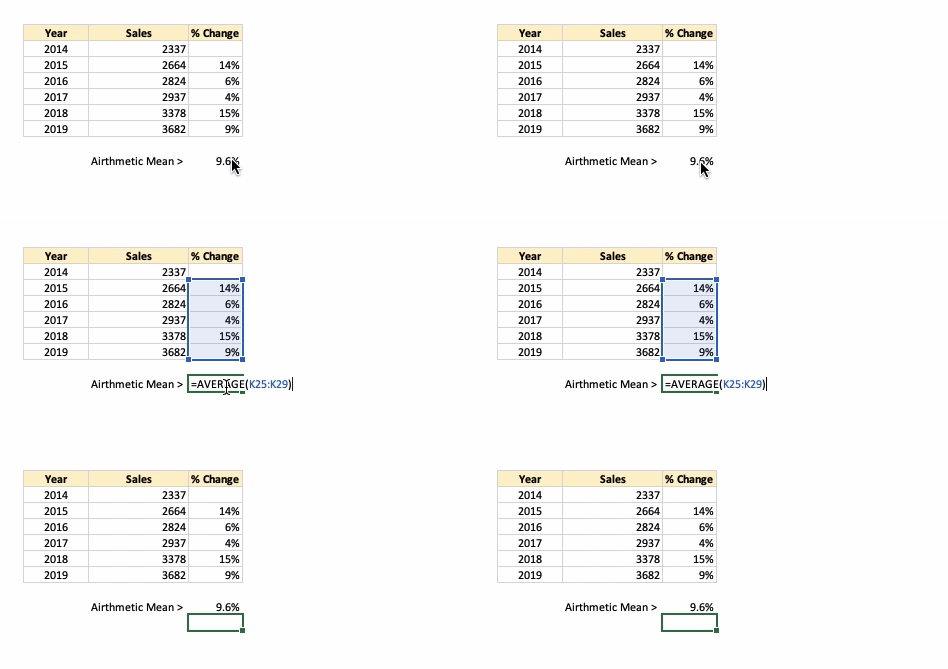
Let us start with an example. Below is the year-over-year sales data, along with the %age change from the previous year:

What is the average %age change from the year 2014 to 2019?
If we calculate the arithmetic mean (aka average) of the % Change, we get 9.6%. It means, each year, there is a 9.6% change from the previous year.

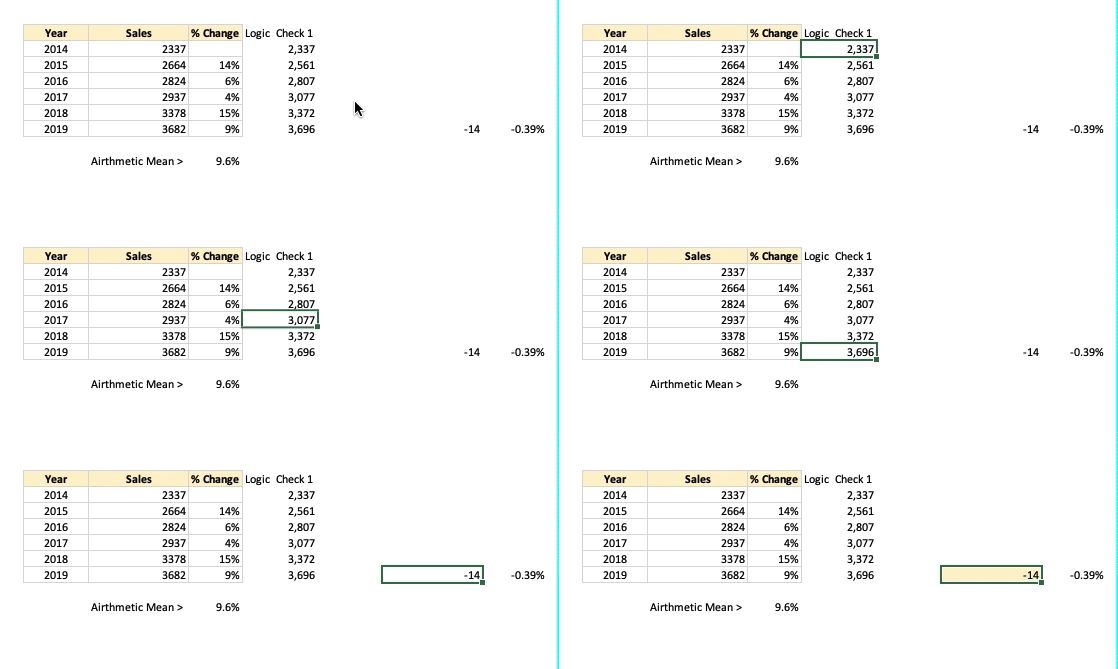
If we apply a 9.6% year-over-year change, we get a different result than 3682 for the year 2019.

There is a difference of 14 units or 0.39%.
It signifies that arithmetic mean or simple average is incorrect in such scenarios.
Geometric Mean for calculating an average of percentages
The geometric mean is applicable in such scenarios. The geometric mean of the above example is 9.5%.

When we apply 9.5% of change from the year 2014, we end up with 3,682 sales in 2019.
In Excel, we use the function GEOMEAN. Just like the function AVERAGE, it takes an array as an input. It requires one adjustment in the formula:
GEOMEAN (1+ <array>) - 1

Adding 1 to the range and then subtracting it offsets significant fluctuations and negative values.
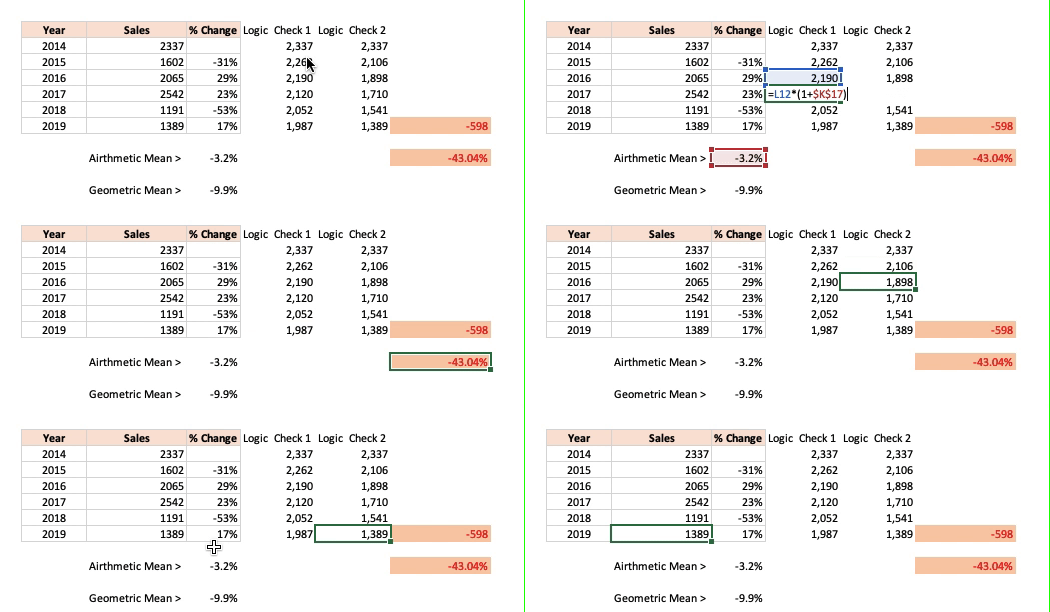
Let us see one more example:

Here we see a significant difference between the average (arithmetic mean) and geometric mean (-3.2% vs. -9.9%).
Following is the difference when we apply this to validate the results:

The geometric mean is used in calculating the overall return% on stocks or investments over
time.
Also, see:
